Using the debugger
When an error occurs you can start using the debugger by creating a cell with the content %debug and execute it.
Please remove this cell from the notebook once done with debugging as it breaks the marking system!
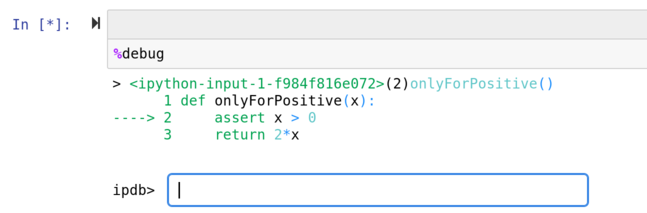
%debug
Debugger commands
This is a command prompt, you can use command in it to navigate.
porprintto print a variablelorlistto show the codeuorupto move up the stackdordownto move down the stackworwhereto show the call stackqorquitto quit, not optional!horhelpto get help
The call stack
Let's us an example
def onlyForPositive(x):
    assert x > 0
    return 2*x
def first(x):
    a = 1
    return second(x + a )

def second(x):
    b = "Important text"
    return third(2*x)

def third(x):
    return onlyForPositive(x)
Let's set off the trap...
first(-9)
---------------------------------------------------------------------------
AssertionError                            Traceback (most recent call last)
<ipython-input-3-507e734bd062> in <module>
----> 1 first(-9)

<ipython-input-2-67307958987f> in first(x)
      1 def first(x):
      2     a = 1
----> 3     return second(x + a )
      4
      5 def second(x):

<ipython-input-2-67307958987f> in second(x)
      5 def second(x):
      6     b = "Important text"
----> 7     return third(2*x)
      8
      9 def third(x):

<ipython-input-2-67307958987f> in third(x)
      8
      9 def third(x):
---> 10     return onlyForPositive(x)

<ipython-input-1-f984f816e072> in onlyForPositive(x)
      1 def onlyForPositive(x):
----> 2     assert x > 0
      3     return 2*x

AssertionError:
This is the call stack: a succession of functions calling each other.
Each "layer" on the stack is a function call, it is called a frame.
If you call the debugger, you get a command prompt:
You can navigate though the call trace using up and down.
You can print the call stack in the debugger using where.
You can print all variable accessible in a frame, and even execute code.
You can also decide where to call the debugger in the code, so you can be more proactive:
from IPython.core.debugger import set_trace
def onlyForPositive(x):
    if x <= 0:
        set_trace()
    assert x > 0
    return 2*x
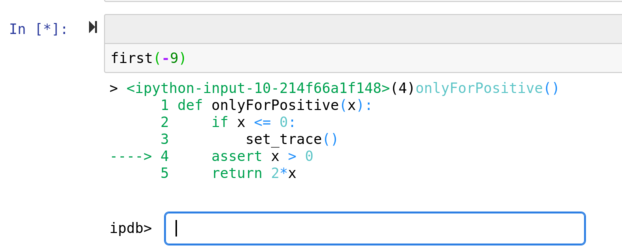
You can now investigate and even fix the value of x if you want!
The debugger can be turned on automatically when you encounter an error using
%pdb
Automatic pdb calling has been turned ON
Calling the same command again turns it off:
%pdb
Automatic pdb calling has been turned OFF