Assignment 5
Help for Assignment 5
General feedback
The problem was solved well by most.
The main issue was calculating the probability for the decay. As seen in the lecture, the probability
$$p = \frac{1}{\tau} \Delta t $$
that many used is only valid for very small $\Delta t \ll \tau$. For larger time step we need to integrate:
$$ \frac{1}{\tau}\int_0^{\Delta t} e^{-t/\tau} dt = \left(1-e^{-\Delta t/\tau}\right).$$
Many students did not use the functions they had written for the later parts of the problem, making work for them and resulting in errors.
Some students still had very long titles and either forgot the units or got them wrong.
We asked for the standard deviation, i.e. not divided by the sqrt of the number of samples.
Automatically graded cells
def has_transitioned(prob):
    r = random.random()
    if r < prob:
        return True
    else:
        return False
def evolveOne(currentState, rules):
    for initial, final, prob in rules:
        if currentState == initial:
            if has_transitioned(prob):
                return final
            else:
                return currentState
        # if no rules applied, return currentState
    return currentState
def evolveMany(states, rules):
    newState = []
    for i, state in enumerate(states):
        newState.append(evolveOne(state, rules))
    return newState
def evolve_system(NA, NB, NC, rules, n_step):
    state = (['A'] * NA)+(['B'] * NB)+(['C'] * NC)

    A_count = numpy.empty(n_step + 1, dtype=int)
    B_count = numpy.empty(n_step + 1, dtype=int)
    C_count = numpy.empty(n_step + 1, dtype=int)

    A_count[0] = NA
    B_count[0] = NB
    C_count[0] = NC


    for i in range(n_step):
        state = evolveMany(state, rules)
        A_count[i+1] = state.count('A')
        B_count[i+1] = state.count('B')
        C_count[i+1] = state.count('C')
    return A_count, B_count, C_count
Plot examples
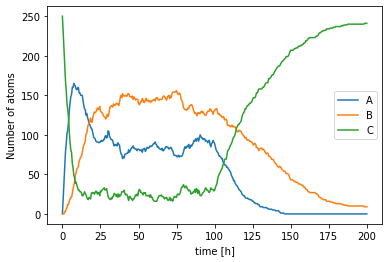
Here are example plots for the assignment:


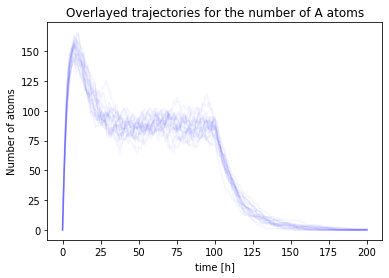
Another way of visualising the uncertainty is to overlay many different trajectories:
ts = numpy.linspace(0, 2*t_total, ntotal)
for i in range(nsim):
    nA, nB, nC = run()
    plt.plot(ts,nA, color='b', alpha=0.04)
plt.title("Overlayed trajectories for the number of A atoms")
plt.xlabel('time [h]')
plt.ylabel('Number of atoms');

Plotting task code example
nsteps = 200
t_total = 100
dt = t_total/nsteps
t_half_A = 10.1
t_half_B = 15.7
t_half_C = 3.2


tau_A = t_half_A / numpy.log(2)
p_decay_A = 1 - numpy.exp(-dt/tau_A)
tau_B = t_half_B / numpy.log(2)
p_decay_B = 1 - numpy.exp(-dt/tau_B)

tau_C = t_half_C / numpy.log(2)
p_decay_C = 1 - numpy.exp(-dt/tau_C)
print (p_decay_A,p_decay_B,p_decay_C)

def run():
    A_count = numpy.empty(2*nsteps + 1, dtype=int)
    B_count = numpy.empty(2*nsteps + 1, dtype=int)
    C_count = numpy.empty(2*nsteps + 1, dtype=int)


    rules = [
        ('A', 'B', p_decay_A),
        ('B', 'C', p_decay_B),
        ('C', 'A', p_decay_C)

    ]


    nA, nB, nC = evolve_system(0,0,250, rules, nsteps)

    A_count[:nsteps+1] = nA
    B_count[:nsteps+1] = nB
    C_count[:nsteps+1] = nC


    rules = [
        ('A', 'B', p_decay_A),
        ('B', 'C', p_decay_B),
    ]

    nA, nB, nC = evolve_system(nA[-1], nB[-1], nC[-1], rules, nsteps)

    A_count[nsteps:] = nA
    B_count[nsteps:] = nB
    C_count[nsteps:] = nC

    return A_count, B_count, C_count

A_count, B_count, C_count = run()

ts = numpy.linspace(0,2*t_total,2*nsteps+1)
plt.plot(ts,A_count, label='A')
plt.plot(ts,B_count, label='B')
plt.plot(ts,C_count, label='C')
plt.legend()
plt.xlabel('time [h]')
plt.ylabel('Number of atoms');
nsim = 20

ts = numpy.linspace(0, 2*t_total, 2*nsteps+1)

values = numpy.empty( (nsim, 2*nsteps+1))
for i in range(nsim):
    nA, nB, nC = run()
    values[i] = nA

averages = numpy.average(values, axis=0)
uncertainties = numpy.std(values, axis=0)
plt.errorbar(ts,averages, yerr=uncertainties, color='b', alpha=0.4);
plt.xlabel('time [h]')
plt.ylabel('Number of atoms');
plt.legend('A')
plt.title('Average and standard deviation for {} simulations'.format(nsim))